Solar
Solar system monitoring via the embedded Victron Energy VRM portal — real-time visibility into solar production, battery storage, generator input, and AC/DC power distribution.

About Victron VRM
The Solar page embeds the Victron Remote Monitoring (VRM) portal directly into e-Boost Realm. VRM is Victron Energy's monitoring platform that enables remote monitoring, control, and optimization of solar/battery systems through compatible GX devices (such as the Cerbo GX or Ekrano GX).
The embedded dashboard receives real-time data updates every 2 seconds directly from the on-site installation, providing a live schematic visualization of energy flow across all connected components.
Dashboard Schematic
The VRM dashboard displays a schematic energy-flow diagram that adapts to the installed system configuration. For Buffalo Inn - 2, the schematic shows five interconnected components with animated flow lines indicating the direction and magnitude of power transfer:
Generator
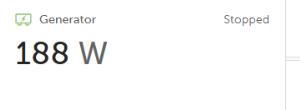
The on-site generator providing AC power to the system. Displays the current power output in watts and the operational state (Running or Stopped). When the generator is stopped, the power value may show the last recorded reading.
Storage (Battery)
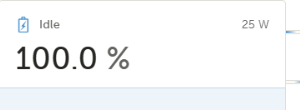
The battery bank managed by the Victron inverter/charger. Shows the State of Charge (SoC %) as the primary reading, the current operating state (Idle, Charging, or Discharging), and the power flow in watts. The battery icon in the center of the schematic visually indicates the charge level. A sparkline chart at the bottom shows recent charge/discharge trends.
AC Loads
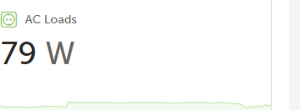
Total AC power consumption from all loads connected to the system's AC output, including EV chargers, site lighting, and other equipment. Displays the current draw in watts with a sparkline chart showing recent consumption trends.
DC Power
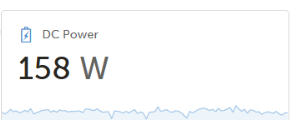
Total DC power being consumed or produced on the DC bus. This includes direct DC loads and battery charging/discharging current. Displays the current power in watts with a sparkline chart showing recent DC bus activity.
PV Charger
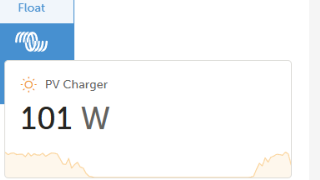
The solar photovoltaic (PV) charge controller output. Displays the current solar production in watts and the charger's operating mode (Bulk, Absorption, Float, Equalization, or Off). The Float label appears above the Victron logo when the battery is fully charged and the charger is in maintenance mode. A sparkline chart shows the solar production curve throughout the day.
Energy Flow Visualization
Animated dashed lines connect the components, showing the direction and path of energy flow through the system:
| Flow Path | Description |
|---|---|
| Generator → Storage | Generator charges the battery bank via the inverter/charger |
| Storage → AC Loads | Battery discharges through the inverter to power AC loads |
| PV Charger → Storage | Solar panels charge the battery via the MPPT charge controller |
| Storage ↔ DC Power | DC bus power exchange between battery and DC loads/sources |
PV Charger States
The PV Charger component displays the current operating mode of the solar charge controller (MPPT). The charge cycle progresses through these stages:
| State | Description |
|---|---|
| Bulk | Maximum power charging phase. The charger delivers as much current as possible to rapidly charge the battery. Battery voltage rises steadily during this phase. This is the primary charging stage. |
| Absorption | Voltage-limited phase. The charger holds the battery at the absorption voltage while gradually reducing current. This phase ensures the battery reaches full charge without overcharging. |
| Float | Maintenance phase. The battery is fully charged and the charger maintains a lower float voltage to keep the battery topped up while minimizing stress. Solar power produced during Float primarily serves loads. |
| Equalization | Periodic conditioning phase (lead-acid batteries only). A controlled overcharge balances cell voltages across the battery bank. This phase is scheduled or manually triggered. |
| Off | Charger is not producing power — typically due to insufficient solar irradiance (nighttime or heavy cloud cover). |
Storage (Battery) States
The central Storage component shows the battery system's current operating state:
| State | Description |
|---|---|
| Charging | Battery is receiving power from the generator, PV charger, or both. Current (A) will show as a positive value flowing into the battery. |
| Discharging | Battery is supplying power to AC or DC loads through the inverter. Current flows out of the battery. |
| Idle | Battery is at or near full charge with no significant load demand. Minimal current flow. This is the normal resting state when solar is in Float mode and loads are low. |
Generator States
The Generator component in the VRM schematic reflects the on-site generator's current operational status:
| State | Description |
|---|---|
| Running | Generator is actively running and supplying AC power to the system. Power output (W) indicates the current load. |
| Stopped | Generator is not running. The system is operating on solar/battery power alone. The power value may show the last recorded reading. |
Sparkline Trend Charts
Each component card includes a small sparkline chart at the bottom showing recent power trends. These mini-charts provide at-a-glance visibility into:
- Solar production patterns throughout the day (PV Charger)
- Load consumption trends (AC Loads, DC Power)
- Generator run periods (Generator)
- Battery charge/discharge cycles (Storage)
VRM Alarm Monitoring
The Victron VRM platform automatically monitors the solar system for alarm conditions. The following parameters are watched on the solar charge controller:
| Monitored Parameter | Description |
|---|---|
| Charger Fault | Hardware or operational fault detected on the PV charge controller |
| Charge State | Abnormal charge state transition or unexpected state change |
| Low Voltage Alarm | Battery voltage has dropped below the configured low threshold |
| High Voltage Alarm | Battery voltage has risen above the configured high threshold |
| Equalization Pending | An equalization charge cycle is scheduled and waiting to execute |
| Error Code | Numeric error code indicating a specific charger fault condition |
VRM alarm notifications can be configured to send email or push notifications when alarm conditions are detected. A built-in rate limiter prevents notification spam when values hover near alarm thresholds.