Logs
Real-time and historical system log viewer for monitoring errors, warnings, and events across all e-Boost locations.
Overview
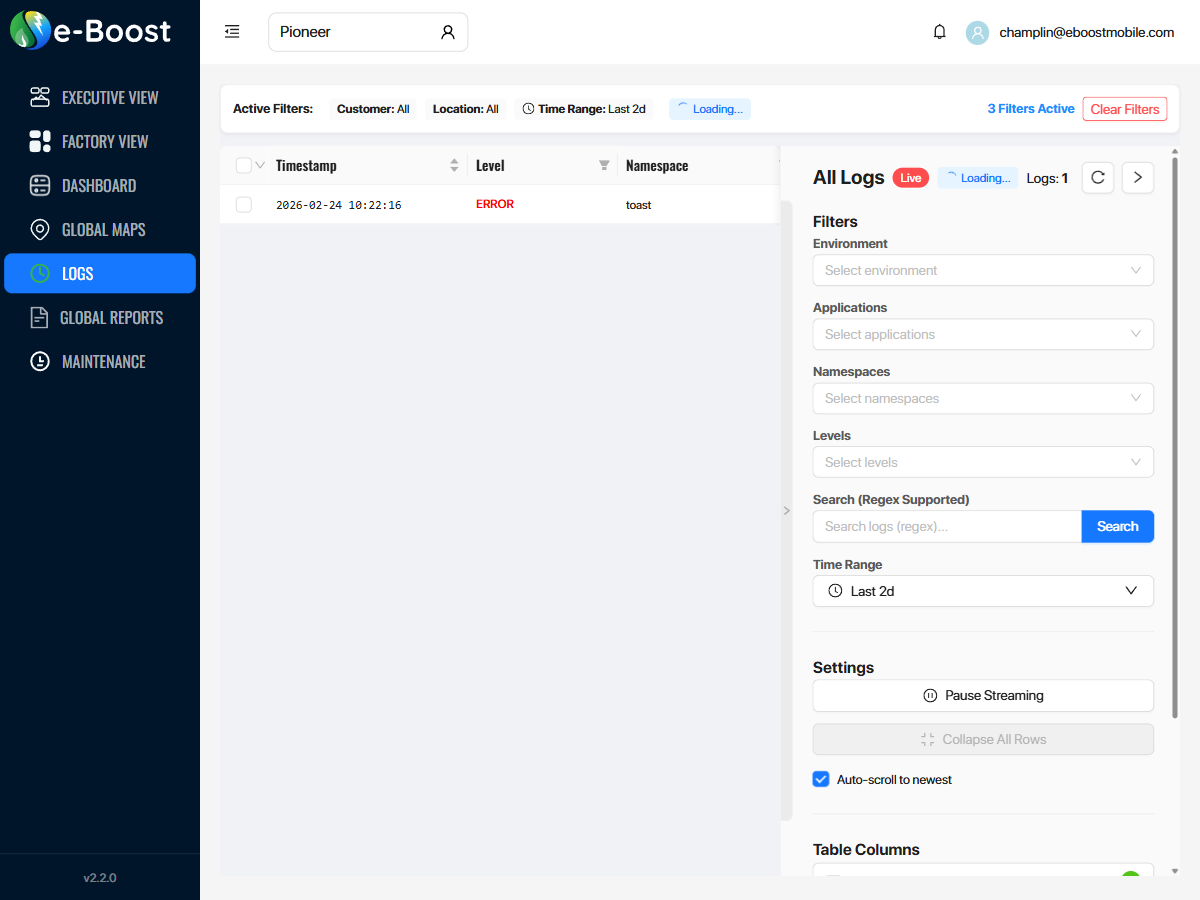
The Logs page provides a centralized, real-time log viewer that streams system events from all e-Boost locations. Logs are collected from on-site hardware and streamed to the dashboard via a live WebSocket connection, allowing operators to monitor errors, warnings, and informational messages as they happen.
Active Filters Bar
The top of the page displays a summary bar showing the currently active filters:
| Filter | Description |
|---|---|
| Customer | Filter logs to a specific customer (default: All) |
| Location | Filter logs to a specific location (default: All) |
| Time Range | How far back to load logs (e.g., Last 2d, Last 7d, Last 30d) |
Click Clear Filters to reset all filters to their defaults.
Log Table
The main area displays a table of log entries. Default columns include:
| Column | Description |
|---|---|
| Timestamp | Date and time the log entry was recorded. Sortable by clicking the column header. |
| Level | Severity level of the log entry: ERROR, WARNING, INFO, DEBUG. Filterable via the column filter icon. |
| Namespace | The system component or service that generated the log (e.g., toast, generator, charger). Filterable. |
| Message | The log message content describing the event or error. |
Click any log row to expand it and view the full message details.
Filter Sidebar
The right sidebar provides detailed filter controls for narrowing down log results:
| Filter | Description |
|---|---|
| Environment | Filter by deployment environment |
| Applications | Filter by application or service name |
| Namespaces | Filter by log namespace (system component) |
| Levels | Filter by severity level (ERROR, WARNING, INFO, DEBUG) |
| Search | Free-text search with regex support — search for specific error messages, codes, or patterns |
| Time Range | Select a predefined time window (e.g., Last 2d, Last 7d) or custom date range |
Settings
| Setting | Description |
|---|---|
| Pause Streaming | Temporarily stops the live WebSocket log stream. Useful when reviewing a specific log entry without new entries pushing it off screen. |
| Collapse All Rows | Collapses any expanded log rows back to their single-line view. |
| Auto-scroll to newest | When enabled (default), the log table automatically scrolls to show the most recent entries as they arrive. |
Table Columns
Click Customize Columns to add or remove columns from the log table. Available columns beyond the defaults may include additional metadata fields depending on the log source.
Export
Logs can be exported for offline analysis or record-keeping:
- Export Selected — exports only the log rows you have checked via the selection checkboxes
- Export All — exports all log entries matching the current filters